
I hold a Bachelor's degree in Biomedical Engineering from Amirkabir University of Technology. I am interested in programming, neuroscience, and data analysis, and on this website, I share interesting things that I learn.
Latest Posts
Impact of Hysteresis System on Signals
6 Nov 2020 4:51 PMHysteresis" is a phenomenon that displays a system's current state dependence on its previous states (the path of changes). According to the concept of this phenomenon, the relationship between cause and effect depends not only on the magnitude of the cause but also on the direction of its changes. This phenomenon has various applications in different fields such as physics, chemistry, engineering, biology, and economics.
In this post, I will investigate the effect of this system on different types of signals using simulation with Python programming. For this purpose, I have designed the following function:
import numpy as np


def hysteresis_apply(_input, _up_cut, _down_cut, _up_way_function, _down_way_function):

    if (_up_way_function(_up_cut) != _down_way_function(_up_cut)) |
(_up_way_function(_down_cut) != _down_way_function(_down_cut)):
        return False

    if _input[0] > _up_cut:
        way = "up-cut"
    elif _input[0] < _down_cut:
        way = "down-cut"
    else:
        way = "down-way"

    _output = np.zeros(len(_input))
    for i in range(0, len(_input)):

        if (_input[i - 1] >= _up_cut) & (_input[i] < _up_cut):
            way = "up-way"
        elif (_input[i - 1] >= _down_cut) & (_input[i] < _down_cut):
            way = "down-cut"
        elif (_input[i - 1] <= _down_cut) & (_input[i] > _down_cut):
            way = "down-way"
        elif (_input[i - 1] <= _up_cut) & (_input[i] >= _up_cut):
            way = "up-cut"

        # value
        if way == "up-way":
            _output[i] = _up_way_function(_input[i])
        elif way == "down-way":
            _output[i] = _down_way_function(_input[i])
        elif way == "up-cut":
            _output[i] = _up_cut
        elif way == "down-cut":
            _output[i] = _down_cut
        else:
            _output[i] = _up_cut * 2
    return _output
And we have also provided the code for using the function in the first image below:
import scipy.io
import matplotlib.pyplot as plt
import numpy as np
from PIL import Image
import glob
from hysteresis_apply_function import hysteresis_apply
mat = scipy.io.loadmat('Data.mat')
begin_t = 0
end_t = 400
t = np.arange(begin_t, end_t, 1)
s = mat['val'][0][begin_t:end_t]
h = np.zeros(end_t - begin_t)
up_cut = 150
down_cut = 75
hysteresis_width = 25
for n in t:
i = n - begin_t
if i <= 200:
s[i] = i
else:
s[i] = 400 - i
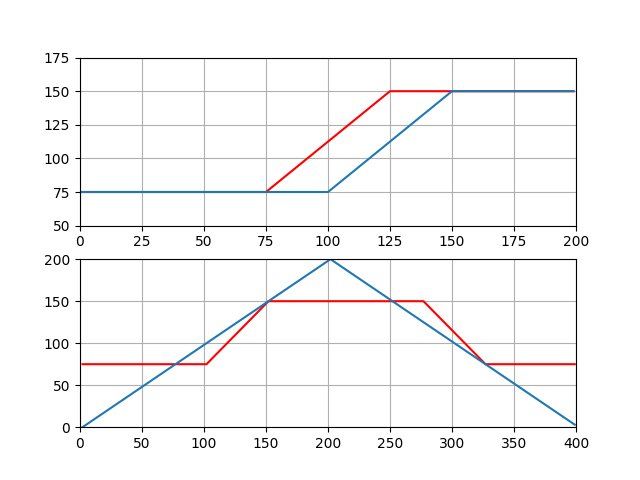
def up_way_function(_input):
m = (up_cut - down_cut) / (up_cut - (down_cut + hysteresis_width))
b = down_cut - m * down_cut
if _input >= up_cut - hysteresis_width:
return up_cut
elif (_input >= down_cut) & (_input <= up_cut - hysteresis_width):
return m * _input + b
else:
return down_cut
def down_way_function(_input):
m = (up_cut - down_cut) / (up_cut - (down_cut + hysteresis_width))
b = down_cut - m * (down_cut + hysteresis_width)
if _input >= up_cut:
return up_cut
elif (_input < up_cut) & (_input >= down_cut + hysteresis_width):
return m * _input + b
else:
return down_cut
n = max(s) - min(s)
rng = range(min(s), max(s))
up_way_plot = np.zeros(n)
for i in rng:
up_way_plot[i - min(s)] = up_way_function(i)
down_way_plot = np.zeros(n)
for i in rng:
down_way_plot[i - min(s)] = down_way_function(i)
plt.subplot(2, 1, 1)
plt.plot(rng, up_way_plot, 'r', rng, down_way_plot)
plt.axis([0, 200, 50, 175])
plt.grid(True)
h = hysteresis_apply(s, up_cut, down_cut, up_way_function, down_way_function)
plt.subplot(2, 1, 2)
plt.plot(t, h, 'r', t, s)
plt.grid(True)
plt.axis([0, 400, 0, 200])
plt.savefig("Triangular_test")
plt.show()
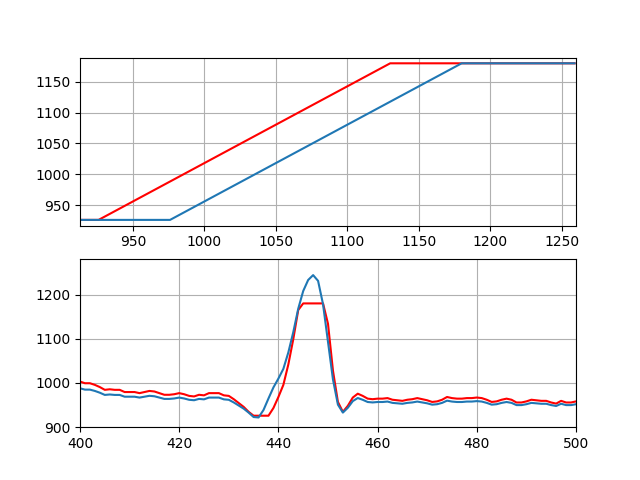
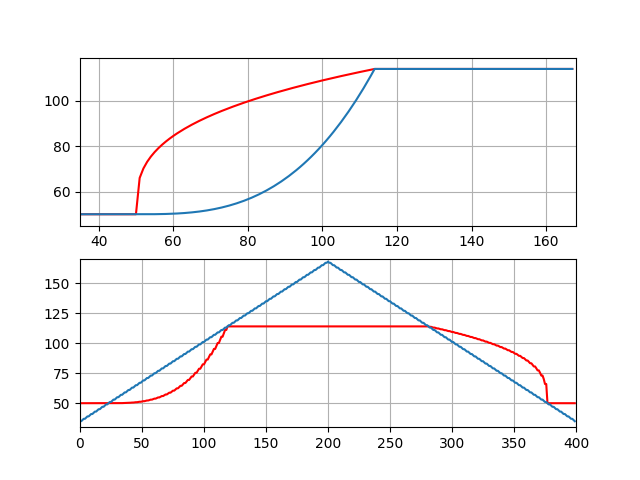
In the plots shown for each state, the top plot represents the input-output function of the system, and in the bottom plot, the blue line represents the original signal while the red line represents the signal modified by hysteresis.

The codes for this post have been posted in the following link:
Tags : Hysterisis , Signal , Python , Programming
Ask your question.
Let's Connect
Feel free to reach out through any of the channels listed below.