
I hold a Bachelor's degree in Biomedical Engineering from Amirkabir University of Technology. I am interested in programming, neuroscience, and data analysis, and on this website, I share interesting things that I learn.
Latest Posts
Solving the traveling salesman problem using genetic algorithm
2 Dec 2021 1:46 PM- General Description of the Program:
- Initial Settings:
At first, the required values are specified:
%% input Configurations
N_Cities = 25;
Cities_Shape = 'sphere';
N_Chromosomes = 500;
Percent_Selection = 50;
Percent_Cross = 45;
Percent_Mutate = 5;
iterations = 5000;
Dimentions = 3;
Area = [3 4 5];
end_check_width = 100;
-
-
- Number of cities (any desired number)
- Position of city points: for this option, I have placed 2 modes:
- Random: Cities are scattered randomly within the specified range.
- Sphere: The points are uniformly selected on the surface of the sphere based on the selected number of cities. (For testing the algorithm)
- Number of chromosomes (any desired number)
- The percentage of selected parents in each stage for transfer to the next stage, mutation, and reproduction (relative to the total number of chromosomes)
- The percentage of reproduction in each stage (relative to the total number of chromosomes)
- The percentage of mutation in each stage (relative to the total number of chromosomes)
- Maximum number of evolution process iterations
- Dimensions of the selected points for the cities (can be 2D or 3D and are determined based on these cities and chromosomes. Also, if sphere is selected, the value must be 3.)
- Space in which cities are scattered (if the program is placed in 2D, it should have 2 values, not 3)
- The range that is checked at each stage to reach the final conditions.
-
-
- Variable initialization:
%% Initialize Variables
text = sprintf(' %s : %s\n',[...
    ["Cities","Chromosomes","% Repupulate","% Cross","% Mutate"];...
    [N_Cities,N_Chromosomes,Percent_Selection,Percent_Cross,Percent_Mutate] ]);
GeneticFunctions.plot_info(text);
N_Selection = floor(N_Chromosomes*Percent_Selection/100);
N_Cross = floor(N_Chromosomes*Percent_Cross/100);
N_Mutate = floor(N_Chromosomes*Percent_Mutate/100);
global Cities Chromosomes
Cities = GenerateRandomData.Cities(N_Cities,Dimentions,Area,Cities_Shape);
Chromosomes = GenerateRandomData.Chromosomes(N_Chromosomes,N_Cities);
best_rank = min(cell2mat(Chromosomes(:,2)));
best_way = Chromosomes{cell2mat(Chromosomes(:,2)) == best_rank , 1};
all_ranks = [];
all_ranks(end+1) = best_rank;
n = 0;
tic
In this section, the problem information is displayed first. Then, the cities and chromosomes are generated from the functions I have written, and a matrix is created to hold the minimum distance of each generation, as well as the best route and its distance in two other parameters. Finally, by calling the "tic" command, the timing is started, and we enter the evolution process.
-
- Evolution
%% Start Evolutionation
while true
    clc; n = n + 1; fprintf('%4d', n);
    if n == iterations
       break;
    end

    [Selected,Not_Selected] = GeneticFunctions.Selection(N_Selection,Chromosomes);
    Cross=GeneticFunctions.Cross(Selected,N_Cross);
    Mutate = GeneticFunctions.Mutation(Cross,N_Mutate);
    Chromosomes = [Selected;Cross;Mutate];


    % check for best way
    ranks_mat = cell2mat(Chromosomes(:,2));
    best = min(ranks_mat);
    all_ranks(end+1) = best;
    if best < best_rank
       best_rank = best;
       index = find(ranks_mat == best_rank);
       best_way = Chromosomes{index , 1};
       title = "Best Guess → " + string(n) + "th Generation , Distance : "...
           +string(best_rank);
       GeneticFunctions.plot_way(best_way,title,Dimentions,all_ranks,'');
    elseif rem(n,1)==0
        check = exist('title','var');
        if check
            GeneticFunctions.plot_way(best_way,title,Dimentions,all_ranks,'');
        end
    end


    % Check for Termination
    if GeneticFunctions.end_condition(end_check_width,all_ranks)
        end_text = {"no improvements in "+string(end_check_width)+...
            " cycles.","Evolutionation Time : "+sprintf('%.2f',toc)};
        GeneticFunctions.plot_way(best_way,title,Dimentions,all_ranks,end_text);
        break
    end
end
In this section, the main work is done by the functions written in the GeneticFunctions class, which include parent selection, reproduction, and mutation process (I performed mutation on children, but there is not much difference). Then, the next generation is reconstructed.
There are also two other stages in the evolution cycle:
- (check for the best way): We save the best child of each generation in an array, and if it is better than all previous generations, we represent it as the best guess. Also, in each stage, we can specify with the rem(n,1) command that the graph of generations' scores is displayed once every few cycles (of course, as mentioned earlier, whenever we reach the best, the graph is also drawn). For example, if we set rem(n,100), after every 100 generations, the graph is plotted and the path is taken.
- (Check for Termination): In this stage, we check if there is no improvement in the past end_check_width generations, the evolution process stops, and the total time of the process is displayed.
- Generating random information
In the previous section, we saw that a function in the class of this file is used randomly to generate cities and chromosomes:
-
- Generating Cities
function Data = Cities(N_Cities,Dimentions,Area,Shape)
    Data = containers.Map('KeyType','char','ValueType','any');
    ASCII_A = double('A');
    if Shape == "random"
        Data('A') = zeros(1,Dimentions);
        for i = 1:1:N_Cities-1
            Data( char(ASCII_A + i) ) = rand(1,Dimentions).*Area;
        end
    elseif Shape == "sphere"
        if Dimentions ~= 3
            error("to make a sphere , Dimentions should be 3!");
        end
        n = sqrt(N_Cities-1);
        if n-floor(n)==0
            n = floor(n);
        else
            n = floor(n)+1;
        end
        [X,Y,Z] = sphere(n);
        X = ([X(1,1);reshape(X(2:n,:),[],(1));X(n+1,1)]+1)/2;
        Y = ([Y(1,1);reshape(Y(2:n,:),[],(1));Y(n+1,1)]+1)/2;
        Z = ([Z(1,1);reshape(Z(2:n,:),[],(1));Z(n+1,1)]+1)/2;
        for i = 1:N_Cities
            Data( char(ASCII_A + i - 1) ) = [X(i) Y(i) Z(i)].*Area;
        end
    end
end
As we can see, in this section, if the random state is selected, a random point (if it is 2D, two numbers, and if it is 3D, three numbers) is chosen between zero and one and is multiplied by the selection area. If the sphere state is also selected, points are generated using the sphere function, and we choose cities from them according to the number of cities.
-
- Generating Chromosomes
function Data = Chromosomes(N_Chromosomes,N_Cities)
    Data = cell(0);
    temp = 'A';
    for i = 1:N_Cities
        temp = string(temp) +  char('A' + i);
    end
    temp = char(temp);
    for i = 1:1:N_Chromosomes
        Data{i,1} = temp(randperm(N_Cities));
        Data{i,2} = GeneticFunctions.Fitness_Function(Data{i,1});
    end
    clear i j temp
end
To select chromosomes, we first define a temp parameter and put letters from A to the end in it for the number of cities, for example, if the number of cities is five, we have:
temp = ‘ABCDE’
Then, to generate each chromosome, we produce a real sequence of random numbers between one and the number of cities (non-repeating), and we adopt the same sequence of cities for the desired chromosome.
- Genetic functions
The Cross, Mutation, Fitness, and functions related to drawing specific explanations do not have any input.
-
- Roulette Wheel:
function [Selected,Not_Selected]  = Roulette_wheel(ranks,Num)
    ranks_sum = sum(ranks);
    ranks = [ranks,(1:1:length(ranks))'];
    output = zeros(Num,1);
    for i = 1:1:Num
        target = ranks_sum*rand(1);
        current = 0;
        for j = 1:1:length(ranks)
            current = current + ranks(j,1);
            if current >= target
                output(i) = ranks(j,2);
                ranks_sum = ranks_sum - ranks(j,1);
                ranks(j,:) = [];
                break
            end
        end
    end
    Selected = output;
    Not_Selected = zeros(length(ranks),1);
    for i = 1:1:length(ranks)
        Not_Selected(i) = ranks(i,2);
    end
end
This function takes an array of scores and a numerical input, and returns the output as the numerical input. The method is uniformly distributed and considers the scores as measurements on a straight line. At each step, a random number between zero and the length of the line is chosen, and the corresponding score is added to the output and removed from the selection.
-
- Selection:
function [Selected,Not_Selected] = Selection(N_Childs,Parents)
    sorted_parents = sortrows(Parents,2);
    d_ranks=cell2mat(sorted_parents(:,2)).^-1;
    d_ranks = d_ranks / min(d_ranks);
    ranks = d_ranks.^20;
    ranks = ranks / min(ranks);
    [Childs_i,Repupulate_i] = GeneticFunctions.Roulette_wheel(ranks,N_Childs);
    Selected = sorted_parents(Childs_i,:);
    Not_Selected = sorted_parents(Repupulate_i,:);
    % GeneticFunctions.test_Roulette_plot(sorted_parents,Childs_i);
end
In this function, the previously mentioned Roulette Wheel function is used. Here, the input is a list of all current parents and a number as the desired number of selected children (N_Selection). Next, the parents' scores are obtained by inverting their distance.
I have realized through trial and error that if we pass the same array to the Roulette Wheel function, the output will have very poor speed and performance. Therefore, I have increased the probability of selecting better parents by normalizing the scores so that there are no values less than zero, and then raising all scores to the power of 20.

I have included the code I wrote to obtain the above images in the test_Roulette_plot function. As can be seen, by raising the probabilities (distance image) to the power of 20, parents with shorter distances are clearly more selected.
The graphs below show the minimum distance plot for each generation over 300 generations, once by giving the inverted distance as a score and once by giving its power of 20 as an input.
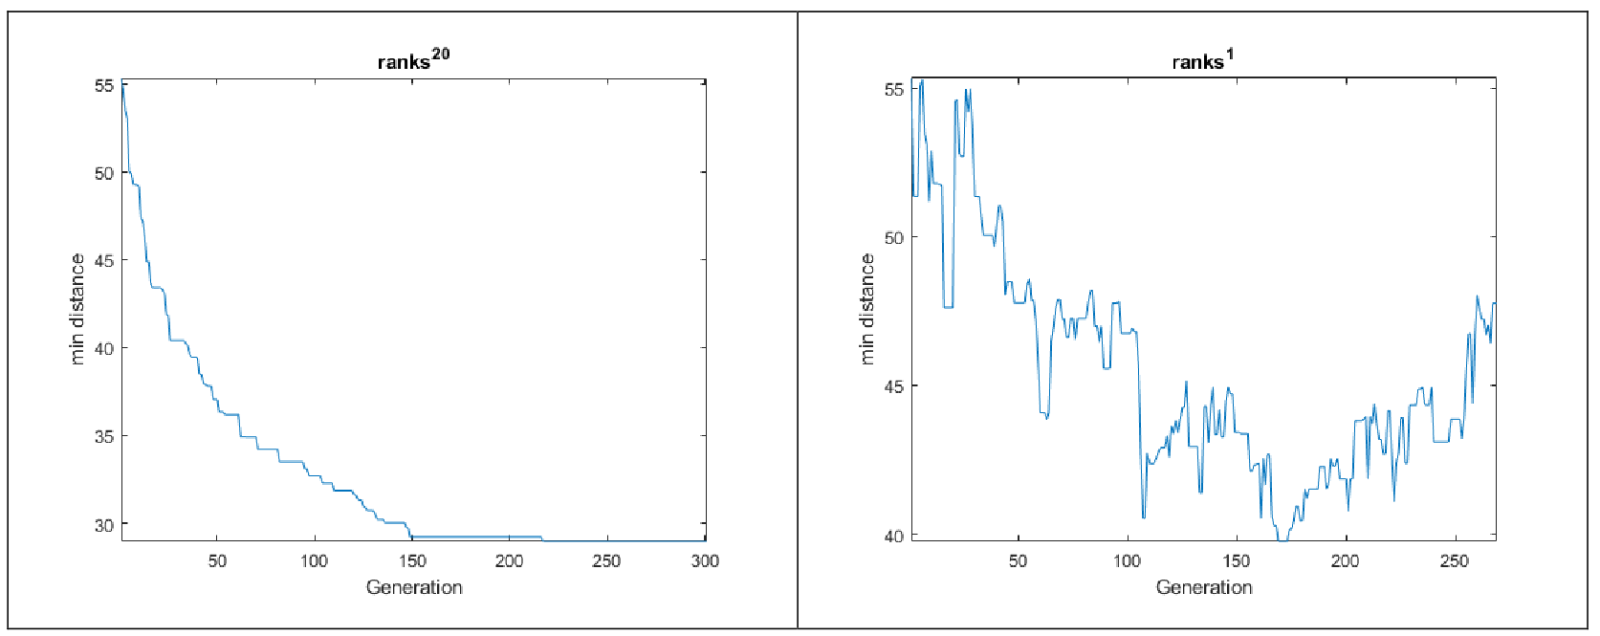
As can be seen, the difference between the two scenarios is significant, and I have also used a power of 20 for the program.
- Results
The codes for this post have been posted in the following link:
Tags : Genetic_Algorithm , Matlab , Traveling_Salesman_Problem
Ask your question.
Let's Connect
Feel free to reach out through any of the channels listed below.